Research
Phase Diagram of Quark Matter
A schematic map of strongly interacting matter as a function of temperature T and baryon chemical potential μB, the version I used in my PhD thesis on color-superconducting quark matter. I drew it in the Mathcha editor and exported it as TikZ, so it can go straight into a LaTeX document.
- QCD
- Color superconductivity
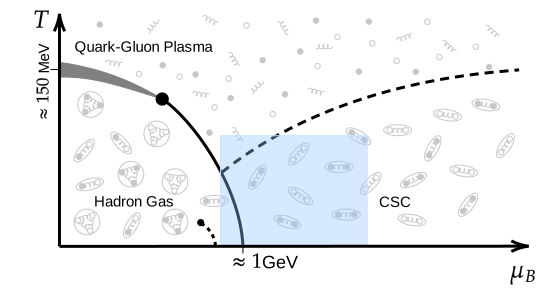
At low temperature and density, quarks and gluons are confined in hadrons (hadron gas); at high temperature they are deconfined into a quark-gluon plasma. Along the temperature axis the change is a smooth crossover around T ≈ 150 MeV (grey band). The crossover turns into a first-order transition at a critical endpoint (black dot), and that line reaches the μB axis at roughly 1 GeV.
At high μB and low temperature, quarks form Cooper pairs and the matter becomes a color superconductor (CSC); the dashed line marks where that pairing melts. The short dotted line ending in a dot near the μB axis is the nuclear liquid-gas transition. The shaded box highlights the cold and dense region that neutron stars probe. The small symbols show the degrees of freedom: free quarks and gluons in the plasma, baryons and mesons in the hadron gas, and quark pairs in the CSC phase.
Downloads
SVG for print and slides at any size, PNG (1095 × 588 px) for quick use, and the TikZ source to edit the diagram or compile it with your document.
TikZ code
Paste it inside a document that loads \usepackage{tikz} (and amsmath for the labels).
Show the TikZ code
Loading…